Portfolio Planning — Seeing Across Projects
A single project schedule shows you when activities start and finish. A portfolio shows you which projects compete for the same resources, which ones block each other, and which sequencing decision ripples across ten contracts at once. Portfolio planning is not a bigger Gantt chart — it is a different lens entirely.
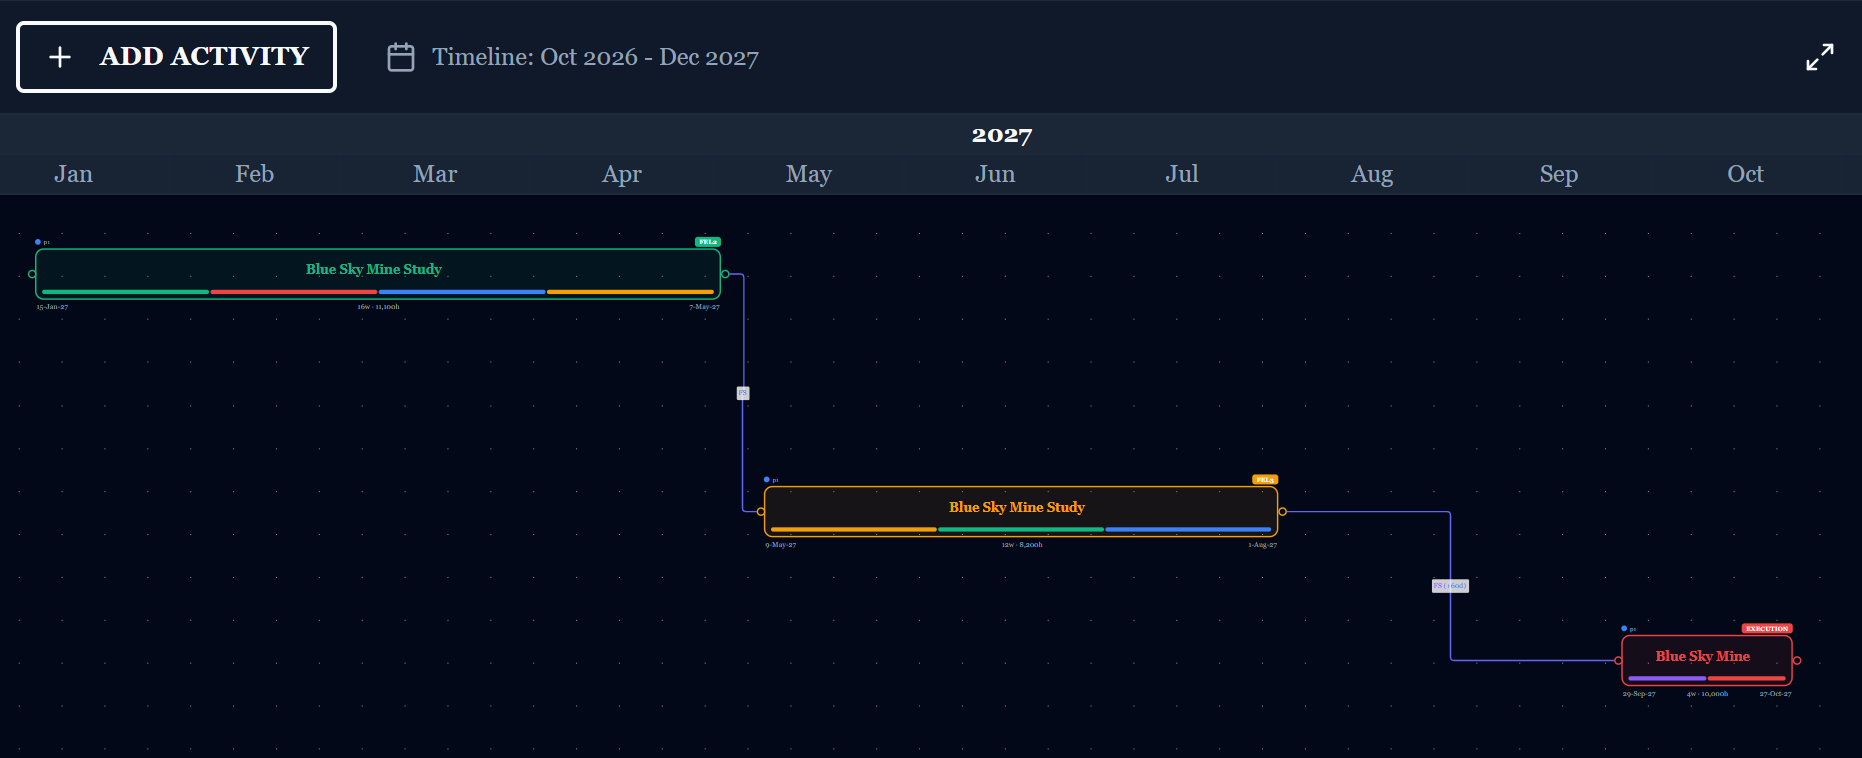
The P3 Portfolio Project Planner — a live view across all projects, their phases, and key inter-project relationships.
Why portfolio planning is a different discipline
Project planning asks: can we deliver this scope by this date? Portfolio planning asks something harder: given everything else we are running, should we start this project now, and what happens to the rest of the portfolio if we do?
AACE RP 68R-11 (Guideline for Preparing a Claim for an Owner's Portfolio) and RP 74R-13 (Basis of Estimate for Capital Projects) both acknowledge that portfolio context — shared contractors, common bulk materials, overlapping engineering firms — changes the risk and cost profile of every individual project within it.
CII Best Practice 36 (Portfolio Management) goes further: organisations that manage execution as a portfolio — not as a collection of independent projects — consistently outperform on schedule and cost predictability.
Project view — activities, milestones, and resources within one scope boundary.
Portfolio view — projects as nodes, with dependencies, resource contention, and strategic sequencing between them.
What the portfolio exposes — contractor mob clashes, shared engineering office bandwidth, common long-lead items, and regulatory bottlenecks invisible at the project level.
The cost of ignoring it — parallel project peaks drive contractor premiums, engineering rework, and site congestion that no individual project schedule can predict.
Inter-project dependencies
The most common planning failure at the portfolio level is treating project schedules as independent. They are not. A shared pipeline corridor, a single export facility, or one engineering contractor creates hard sequencing constraints that no individual project schedule will surface on its own. These are inter-project dependencies — and they need to be mapped explicitly, not discovered during execution.
Infrastructure predecessors — road, power, water, or shared facility that must complete before downstream projects can mob.
Engineering office throughput — two projects at peak IFR concurrently overload one firm.
Regulatory gates — permits or approvals that serialise projects regardless of schedule intent.
Each project planner optimises their own schedule. Nobody owns the between-project logic.
PMO reporting aggregates cost and schedule but rarely models project-to-project logic ties.
Dependencies only become visible when both projects are in execution — too late to resequence cheaply.
The P3 Portfolio Planner lets you define and visualise inter-project dependency links across your full project list.
Dependency types, owning teams, and forecast impact are tracked alongside each project's phase timeline.
Slippage in one project propagates visually to every downstream project that depends on it.
Resource levelling across the portfolio
At the project level, resource levelling smooths activity peaks within one schedule. At the portfolio level, the same logic applies to contractors, engineering firms, fabricators, and even regulatory reviewers — but the levers are project start dates and phase offsets, not activity floats. CII Best Practice 7 (Planning for Startup) and AACE RP 68R-11 both note that contractor market capacity is a binding constraint that must be modelled at the portfolio level, not estimated project by project.
Phased execution and strategic sequencing
Not every project in a portfolio needs to start at the same time — and in most capital programmes, trying to run them concurrently is the single largest driver of overruns. Strategic sequencing is the deliberate decision to phase project starts to smooth resource demand, reduce risk overlap, and ensure that enabling infrastructure precedes dependent projects. AACE RP 74R-13 frames this as a basis-of-estimate decision: the execution strategy assumed at estimate time must match the portfolio reality, not an idealised single-project plan.
Portfolio-level reporting and variance
An individual project report answers "are we on schedule?" A portfolio report answers "which projects are slipping, by how much, and does that slippage propagate to other projects?" AACE RP 29R-03 (Forensic Schedule Analysis) applies at the portfolio level when inter-project logic is modelled — a delay in Project A that pushes Project B's mob date is a forensic schedule event spanning two budgets.
Grounded in AACE and CII guidance
Portfolio planning is addressed across AACE Recommended Practices and CII Best Practices. The references below are the core reads for anyone managing a capital project portfolio.
Portfolio planning connects every chapter
Portfolio planning sits above — and depends on — every other discipline in this series.
See your portfolio in one view
The P3 Portfolio Project Planner puts your full project list, phase timelines, inter-project dependencies, and resource peaks into a single live view — built for capital project owners, not generic task managers.